
Vea también


 18.11.2026 05:20 AM
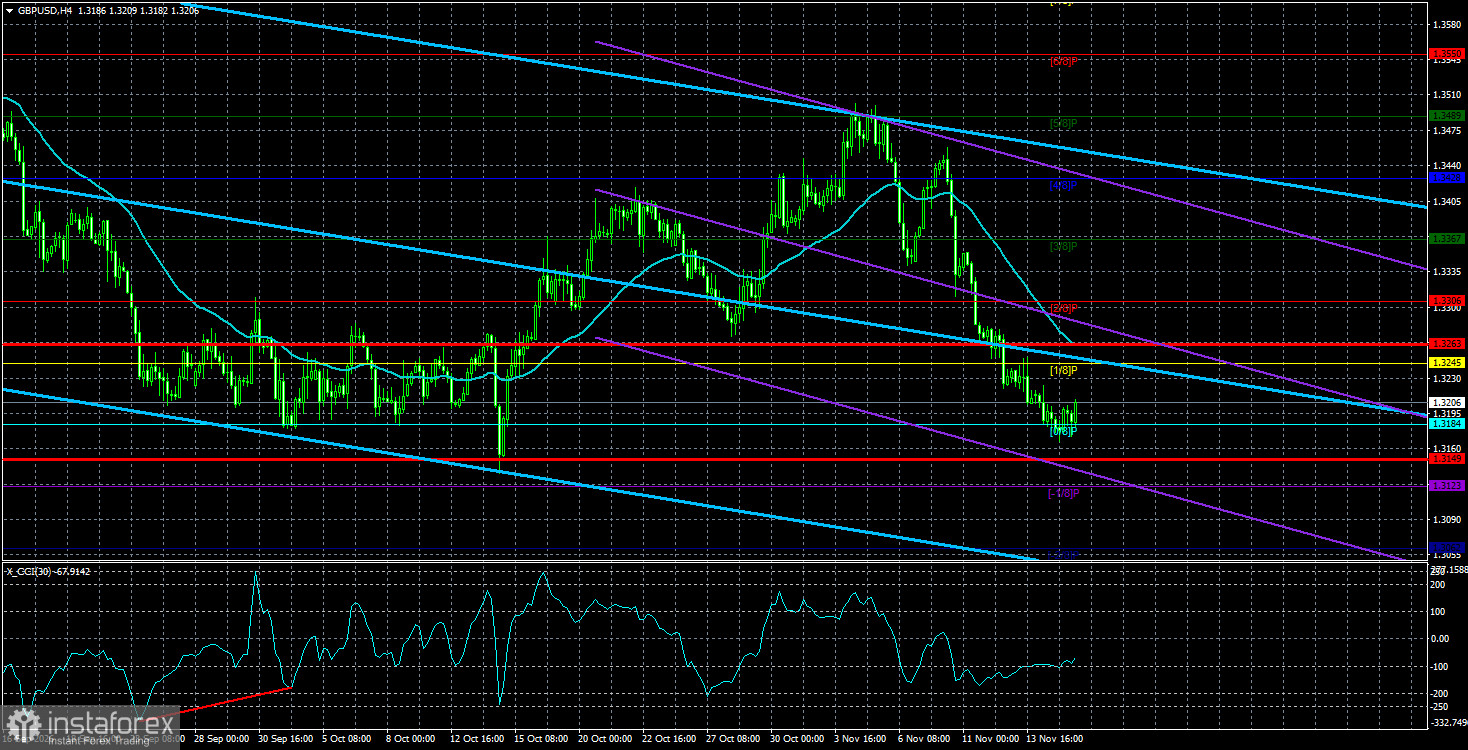
The GBP/USD currency pair continued its downward movement on Tuesday, unabashedly. Market "hawkish" expectations about Federal Reserve policy are rising, so the dollar can quite plausibly continue to gain for several more months — until the Fed openly declares the end of its tightening cycle. The pound has fallen for a full week and over that period lost as much as it gained in the prior three weeks. On some days the pound's fall and the dollar's rise were fully understandable — for example, the Friday with strong US labor reports, or last Tuesday when US inflation slightly beat expectations. But the inflation beat was marginal, and the annual figure remained unclear. Yet the pound fell for a fifth consecutive day, losing 260 pips. Are market "hawkish" expectations really so powerful, and US inflation rising so fast, that all other factors — for example, simultaneous Bank of England tightening — no longer matter?
Technically, the pound's picture remains unchanged. This week GBP/USD returned to the 1.3150–1.3180 area, which aggregates the lower bounds of two sideways channels on the daily and weekly timeframes. Thus, the pound's fate will be decided in this area at least for the coming weeks. Recall that the pair has traded sideways within the daily timeframe channel for a year, so breaking out without strong justification will be difficult. In essence, the market has reverted to a "buy the dollar because the Fed will raise rates" strategy. If this single factor is enough to sustain a long-term downtrend, there is little to do. If any logic remains, however, the 1.3150–1.3180 area should hold.
On Tuesday, the UK unemployment report showed a second consecutive decline in unemployment — an outcome the market did not expect. How did the market react to the second drop in unemployment? A 25-pip rise followed by a 25-pip fall. Do we need more evidence that virtually all factors supporting the pound are being ignored, and the market sees only the dollar and the Fed?
We will not repeat ourselves further. Although the pound has traded far more logically than the euro in 2026, it still cannot produce a consistent rise in many cases. Geopolitics has strongly supported the dollar, but that factor's shelf life has long expired, and the Middle East war has been on pause for months. Thus geopolitics alone does not justify continued dollar strength. In our view, the market is pushing the pound as low as possible now to set up the resumption of the 2022 global uptrend later — effectively creating opportunities to open large long positions at the lowest possible prices.
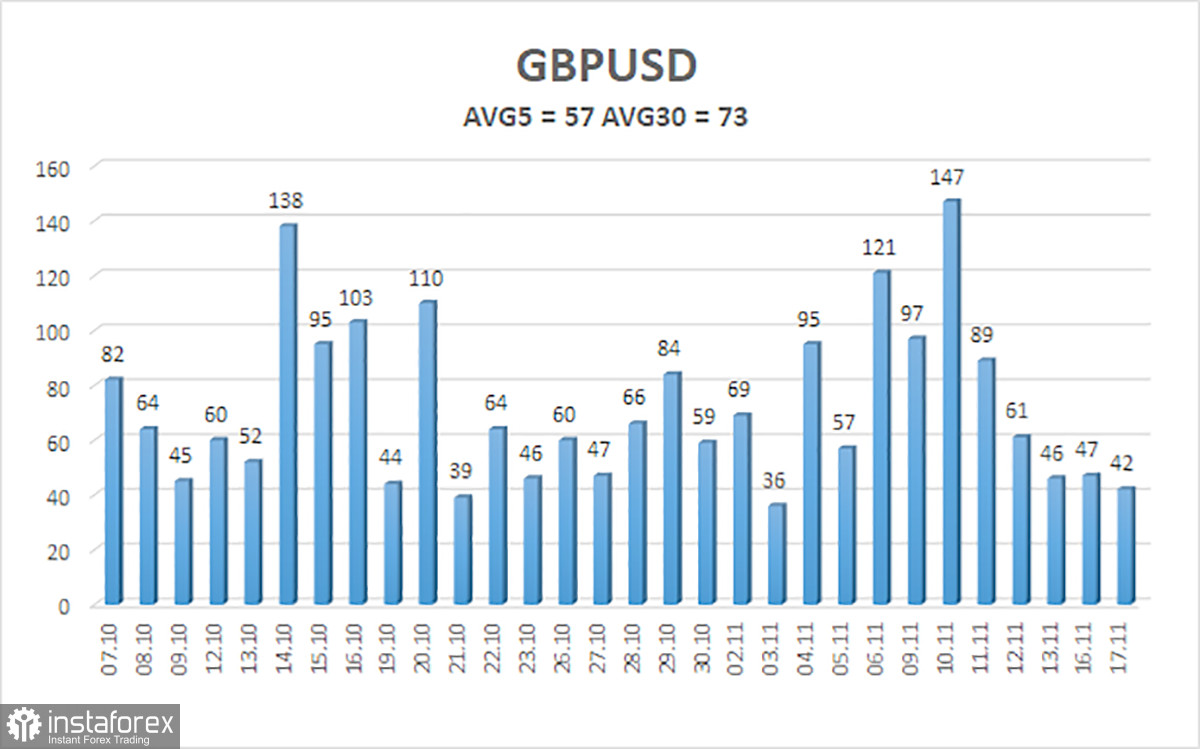
The average volatility of the GBP/USD pair over the last 5 trading days is 57 pips. For the pound/dollar pair, this value is "average." On Wednesday, November 18, we therefore expect movement within the range bounded by the levels 1.3149 and 1.3263. The higher linear regression channel is directed downward, indicating a downtrend. The CCI indicator has recently not entered overbought/oversold areas and has not formed divergences.
S1 – 1.3184
S2 – 1.3123
S3 – 1.3062
R1 – 1.3245
R2 – 1.3306
R3 – 1.3367
The GBP/USD currency pair has entered a new downward trend within a sideways channel on the daily timeframe. 2026 has been very positive for the dollar because geopolitics and inflation forced capital to seek safety and brought the Fed back to tightening monetary policy. However, on the weekly timeframe, price remains flat between 1.3150 and 1.3780 within a four-year uptrend, supporting the prospect of pound appreciation in the medium term. Consider long positions with targets of 1.3367 and 1.3428 when price is above the moving average. With the price below the moving average, trade to the downside with a target of 1.3150–1.3180. Be careful with short positions — the price is again approaching the lower bounds of the sideways channels.


