
Vea también


 18.11.2026 07:51 AM
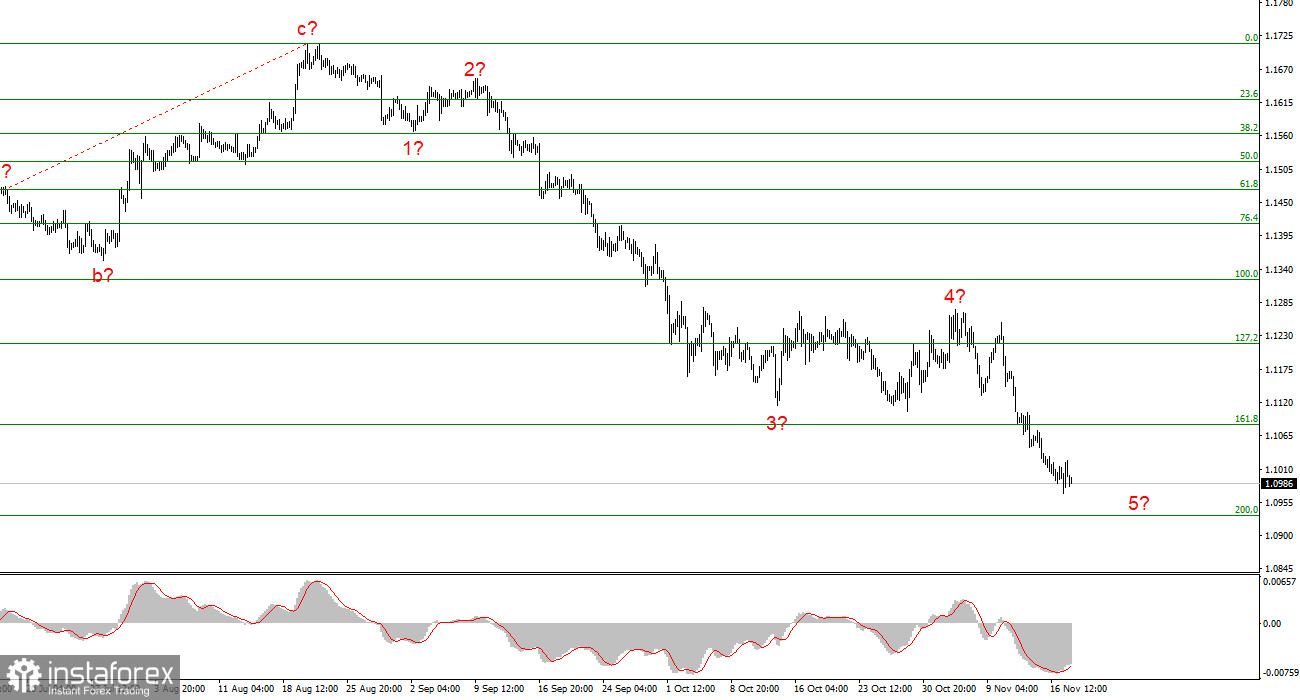
The wave count on the 4-hour EUR/USD chart has become more complex. On the higher time frame (bottom chart), the downward trend segment has taken the form of a five-wave structure, A-B-C-D-E, which could be complete at any moment, as it appears sufficiently developed. All the waves within this segment are approximately equal in size, which is why it is considered corrective. If this assumption is correct, an impulsive upward trend segment will begin to develop once the current structure is complete, with targets located well above the 1.2000 level.
On the lower time frame (top chart), the development of an impulsive wave sequence is continuing, which may belong to wave E of the higher time frame. If this is indeed the case, then regardless of how strongly the dollar rises, its strengthening is nearing an end. The presumed wave 5 of E is approaching completion. In any case, the current wave structure suggests that the development of the downward wave sequence is nearing completion on both charts. News developments and a sharp shift in market sentiment have led to a strong appreciation of the US currency, but there are few remaining reasons for further dollar strength.
Hawkish sentiment continues to strengthen.
The EUR/USD exchange rate remained virtually unchanged throughout Tuesday, as market participants finally regained some composure toward the end of the day and bought back some of the euro, which had been falling sharply. Nevertheless, Tuesday provided another example of a situation in which the European currency could have gained at least 50 points, given its oversold condition and uninterrupted decline over the past three months. However, even on a day when the news flow was favorable to the euro, the currency demonstrated nothing but weakness.
It is worth recalling that both economic expectations indices for the European Union and Germany came in considerably more optimistic than expected. By contrast, the US industrial production report was disappointing. Industrial output declined by 0.4%, compared with market expectations for an increase of 0.1–0.3% month over month. As a result, the dollar weakened following the disappointing industrial production data but continued to appreciate during the rest of the trading session. Therefore, one weak US economic report did nothing to change the outlook for EUR/USD.
The same pattern keeps repeating. Market participants readily price in strong US economic data and weak data from the European Union. They focus exclusively on the prospect of tighter monetary policy by the Federal Reserve, overlook improvements in the geopolitical situation in the Middle East and Eastern Europe, and disregard the easing energy crisis. In other words, the market continues to favor factors that support its current strategy while ignoring all others. Economists of various persuasions, meanwhile, justify these market movements by arguing that the monetary policy outlooks of the ECB and the Fed are diverging significantly in terms of future interest rate increases, while the ZEW indices and other reports supporting the euro are not considered important enough to warrant attention.
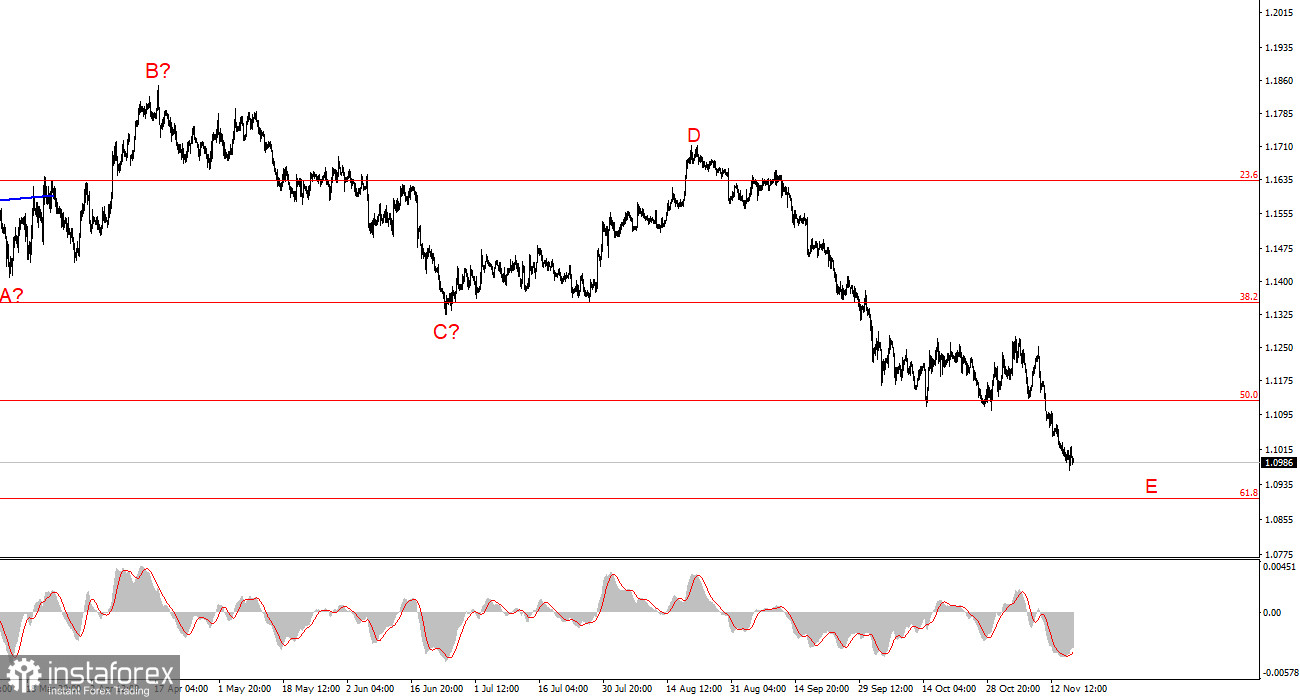
Based on the EUR/USD analysis, the conclusion is that the pair remains within the framework of a global corrective trend segment, A-B-C-D-E. However, this structure appears fully developed and could be complete at any moment. In the current situation, this may be a good time not only to consider buying the European currency but also to anticipate the development of a sustained upward trend segment. According to the higher time frame, the exchange rate is expected to rise to at least the 1.1700–1.1800 levels. The stronger the pair declines now, the stronger its subsequent rise could be. However, confirmation is still needed that the downward wave sequence has been completed. One possible signal would be an unsuccessful attempt to break above 1.0902, corresponding to the 61.8% Fibonacci level on the higher time frame.
The higher time frame shows a downward trend segment that has taken the form of an A-B-C-D-E structure. The internal wave structure of wave E has developed into a five-wave impulsive pattern, but this pattern may already be complete. If this assumption is correct, a new upward trend segment will begin to develop in the near future.
The main principles of the analysis:


